

The Real Cost of IT for South Florida Small Businesses
What South Florida small businesses pay for managed IT, security, internet, hardware, and support—benchmarked by company size and cost per employee.


For a 10–50-person South Florida business using outsourced IT support, our modeled recurring stack costs approximately $128–$250 per employee per month. That covers productivity software, endpoint security, backup, password management, network hardware amortized over its life, and ongoing support. It excludes workstations, connectivity, industry-specific applications, cloud hosting, AI tools, and internal IT payroll.
The second finding is less obvious. In one software environment we audited and documented in full, 30% of monthly subscription spend proved recoverable — paid for, but not used. Both conditions tend to be true of the same business at the same time. Overspending and underspending are not opposites. They coexist, in different categories, in the same budget.
TL;DR:
- $128–$250 per employee per month is the modeled range across 10, 25, and 50-person businesses, covering outsourced support, software, security, backup, and amortized network hardware.
- Support is approximately 80% of the bill. Every piece of software combined is the remaining fifth.
- $125–$250 per user per month is the standard managed IT range in our market. Compliance-heavy scope with hosting or 24/7 security monitoring reaches $300–$400. Monitoring-only agreements start around $99.
- $3,500–$8,000 covers a professionally installed network for a 10–25 employee office. Cabling adds $150–$200 per drop.
- In our glass-heavy South Florida office deployments, access-point counts have typically been 30–40% higher than in similarly sized drywall spaces — a Brickell cost that national benchmarks miss.
- Power quality has caused more device losses than hardware defects in our fleet data. Three of four recorded losses across 538 devices over four years were environmental — a small sample, but a consistent pattern across our deployments.
A note on sourcing. This report labels its evidence throughout. Deployment data comes from our own work in this market — 20+ years serving South Florida businesses, 40+ office network installations, and a 538-device fleet monitored across four years. Third-party data is linked to its primary source so you can check it. Where a figure could not be verified to a primary source, we left it out.
Where You Stand: Five Questions
Before the benchmarks, the diagnostic. These five questions locate most problems in an afternoon, and none of them require software or a consultant.
- What is your per-employee monthly IT cost? Total every recurring technology charge, divide by headcount, compare against $128–$250. Note which side you land on.
- When did you last restore a file from backup? Not "is backup running" — when did someone last verify that a restore worked. If the answer is not within 90 days, start here.
- How many active software subscriptions do you have, and who used each one last month? Pull recurring charges from bank and card statements. Cross-reference against admin dashboards showing last login.
- What connects your office to the internet, and what happens when it fails? If there is no second path, price a failover circuit against a day of downtime.
- Who has access to what, and does that list include anyone who no longer works here? In our experience, orphaned accounts belonging to former employees appear in nearly every access review we conduct.
The rest of this report is the reference data behind those five questions. If you would rather work through question five with a structured checklist, our business security score assessment covers access review alongside the other controls insurers now ask about.
What South Florida Businesses Spend, by Size
The most useful way to express IT cost is per employee, per month. It normalizes across company size and makes comparison possible.
| Company size | Monthly total | Per employee/month |
|---|---|---|
| 10 employees | $1,275–$2,290 | $128–$229 |
| 25 employees | $3,785–$6,240 | $151–$250 |
| 50 employees | $7,440–$12,245 | $149–$245 |
Note: the 10-person model uses a lower per-user support rate ($100–$150) than the 25-person model ($125–$200), reflecting that smaller accounts are often priced differently — some providers offer reduced rates at lower headcounts, while others apply monthly minimums. The 25-person category breakdown below shows the full derivation. The 10- and 50-person totals follow the same structure with adjusted inputs for scale.
The bands barely move as headcount grows. Volume discounts on software are real but modest, and they are offset by the additional infrastructure, redundancy, and support complexity that more people require. A 50-person business is not meaningfully cheaper per head than a 25-person business.
What this number counts — and why you will see very different figures elsewhere
Search for IT spending per employee and you will find numbers ranging from under $100 a month to over $1,000. Before comparing ours to any of them, it is worth knowing exactly what is inside this one.
Counted here: productivity software, endpoint security, backup, password management, network hardware amortized across its service life, and ongoing IT support.
Not counted: internal IT salaries, telecom and mobile plans, cloud infrastructure and hosting, line-of-business applications such as accounting or practice management, workstation purchases as capital expenditure, and AI licensing.
Why our number sits below most published benchmarks. Enterprise-oriented studies — such as Gartner's IT Key Metrics Data and the Avasant IT Spending and Staffing Benchmarks — report substantially higher per-employee figures because they include internal IT salaries, telecom, cloud infrastructure, workstation capital, and industry-specific software. Those studies also focus on larger organizations (Avasant's sample generally starts at $50 million in revenue or $1 million in IT budget). Our figure answers a narrower and, for a 5–50 person business, more actionable question: what does the outsourced SMB stack cost in this market. If you encounter published benchmarks several times higher than ours, the gap is almost always a scope difference — understanding what each benchmark includes and excludes matters more than the number itself.
A caution about the figures circulating online. Most freely available per-employee numbers are secondhand restatements from vendor and lead-generation sites, often attributed to Gartner without a traceable citation. If you need a defensible external benchmark for a board conversation, the Avasant study linked above segments by organization size, and the free Spiceworks Ziff Davis State of IT survey reports real SMB budget data.
Treat our number as what it is: a bottom-up model of the outsourced SMB stack in this market, built from the category costs in the table below, and useful mainly for checking whether your own stack is priced sensibly.
Here is the same money broken into categories, for a 25-person business:
| Category | Monthly (25 people) | Unit economics |
|---|---|---|
| IT support (managed services) | $3,125–$5,000 | $125–$200/user |
| Productivity suite | $150–$350 | $7–$14/user |
| Password manager | $100–$200 | $4–$8/user |
| Endpoint security | $75–$150 | $3–$6/endpoint |
| Backup (local + cloud) | $60–$100 | Combined |
| Network hardware (amortized) | $25–$40 | $1,500–$2,500 ÷ 60 months |
| Contingency / refresh reserve | $250–$400 | — |
Support represents approximately 80% of the bill. Everything else — all the software, all the security tooling, all the hardware — is the remaining fifth. This is worth knowing before a budget review, because it tells you where attention pays off. A $4 difference on a password manager across 25 users is $100 a month. A poorly scoped support agreement is a multiple of that, and it is the line most businesses examine least.
The revenue cross-check
Percentage of revenue is a sanity check rather than a planning tool. Industry sources commonly cite a band of 2–7% of annual revenue, though the exact range varies by study, scope, and sector. Financial services, healthcare, and legal practices tend to run higher because of compliance obligations; manufacturing and construction typically sit lower. No single source produces a universally accepted figure, so treat any percentage as a reference point rather than a target. Build the budget bottom-up from the category table, then test the result against the percentage — and if it lands outside the expected band for your sector, understand why before adjusting it.
How Managed IT Is Priced
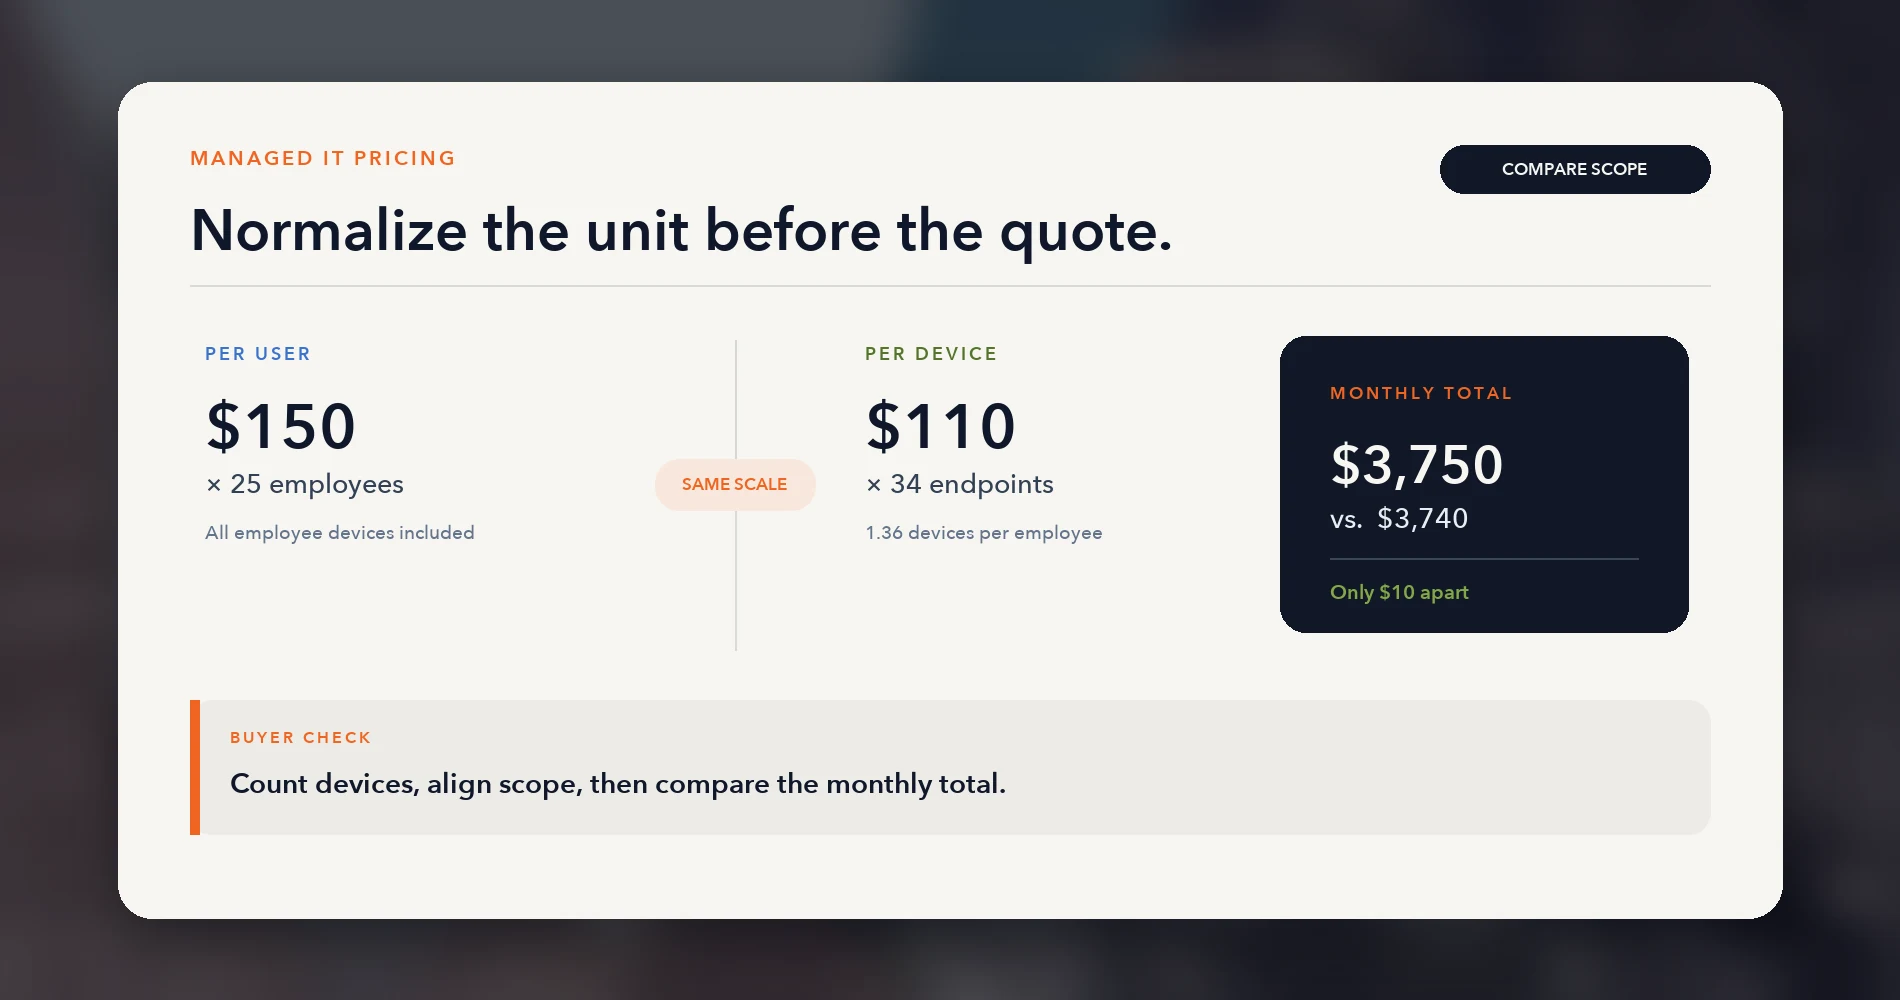
Most cost confusion comes from comparing quotes built on different models. There are three, and they are not interchangeable.
Per user, per month. A flat fee for each employee, covering all their devices. Predictable as headcount changes, and the dominant model for businesses under 50 people. This is the model most of the figures in this report use.
Per device, per month. A flat fee per endpoint, typically $50–$100 per workstation and $100–$400 per server, with network gear priced separately. Favorable when employees share machines — a warehouse with 50 people on 12 terminals pays far less this way. Expensive when each person carries a laptop, a desktop, and a tablet. Count your actual device-to-employee ratio before comparing a per-device quote to a per-user one; they are not the same number wearing different clothes.
Tiered or bundled. Fixed packages at set price points, sometimes with a full-service monthly minimum. Useful when your needs are stable and well understood; harder to compare across providers, because two packages at the same price rarely contain the same things.
A per-user quote at $150 and a per-device quote at $110 can be the same money or wildly different money depending on your device count. Normalize before you compare.
What the market charges
The figures below come from 20+ years of quoting work in this market and from the competing proposals clients bring us during onboarding. Most South Florida providers quote privately rather than publishing rate cards. What follows is our read of the market, presented as field experience rather than a formal survey.
Standard managed coverage runs $125–$250 per user per month. That means helpdesk, monitoring, patch management, and backup administration, with the endpoint security stack included rather than billed on top. Most South Florida proposals we see for a 10–50 person business land between $150 and $200.
Compliance-grade scope runs $300–$400 per user per month. This tier is real and routinely missing from cost conversations. It usually means one of three things, and they are worth separating before you accept a number that high: the provider is hosting infrastructure for you, the agreement includes 24/7 security monitoring with human response, or project labor is bundled into the monthly fee. If a quote lands up here, ask which. Our IT stack breakdown for a 10-person accounting firm walks through what that scope actually buys.
Monitoring-only agreements run $99–$150 per month, with remediation billed separately at $175–$350 per hour. The headline number is attractive, but monitoring-only plans can become more expensive when remediation is billed separately, particularly during a prolonged outage.
Our own rate is $125–$175 per user per month for clients on infrastructure we installed. We publish it because a cost report should be transparent about its own pricing alongside the market data it presents.
Rates cluster more tightly than most buyers expect, which makes scope comparison more useful than price comparison. Agreements at similar prices routinely differ on:
- Whether security tooling is included or billed separately
- Whether after-hours and weekend coverage exists, and at what rate
- Whether hardware procurement, vendor escalation, and end-user training are in or out
- What the response commitment is, expressed as a number rather than an assurance
A comprehensive agreement at $175 is frequently cheaper in practice than a $110 agreement that bills separately for endpoint protection, backup administration, and anything after 5pm. To model your own headcount against these bands, our IT support cost calculator runs the arithmetic. For a comparison of what local providers specialize in, see our guide to IT companies in Miami.
Co-managed IT
The model most businesses in the 25–50 range overlook. Rather than replacing internal capability, a co-managed arrangement supplements it — the internal person handles daily support and institutional knowledge, the provider handles monitoring, security tooling, patching, and escalation. It suits businesses that have outgrown pure outsourcing but cannot yet justify a full internal team. Pricing typically falls below a full managed agreement because the provider carries less of the day-to-day load.
Adjacent labor rates
Deployment data — South Florida rates from work we have performed or quoted.
| Service | Rate |
|---|---|
| Break-fix emergency labor | $175–$300/hour |
| South Florida managed services labor | $100–$150/hour |
| Part-time IT contractor | $75–$150/hour |
| Network configuration and documentation | $800–$1,500 per project |
| Single-day installation labor (30-person office) | $1,200–$1,500 |
| Security assessment | $1,500–$5,000 |
Reactive break-fix support costs meaningfully more annually than a managed agreement covering the same environment. The premium is not the hourly rate — it is that break-fix work happens under time pressure, at the worst moment, without the context that comes from knowing the environment.
Connectivity: Miami Street Pricing
Business internet in Miami comes down to two providers for most addresses, with meaningful availability gaps between them.
AT&T Business Fiber — symmetrical speeds. The bundled rate requires pairing with an eligible business wireless plan.
| Speed | Standalone | Bundled |
|---|---|---|
| 300 Mbps | $60/mo | $30/mo |
| 500 Mbps | $100/mo | $60/mo |
| 1 Gbps | $140/mo | $90/mo |
| 2 Gbps | $185/mo | $135/mo |
| 5 Gbps | $285/mo | $235/mo |
Comcast Business — cable, asymmetrical. Upload speeds are address- and network-dependent and should be confirmed in the service order; older service areas commonly deliver 35 Mbps upload regardless of download tier, though DOCSIS 4.0 upgrades are reaching select areas.
| Tier | Speed | First-year price | Without autopay |
|---|---|---|---|
| Standard | Up to 300 Mbps | $60/mo | $70/mo |
| Performance | Up to 500 Mbps | $90/mo | $100/mo |
| Gigabit Extra | Up to 1.25 Gbps | $140/mo | $150/mo |
| 2 Gigabit | Up to 2 Gbps | $170/mo | $180/mo |
First-year prices assume a one-year agreement with autopay and paperless billing from a bank account, which provides a $10/mo discount. Comcast retired the older 150 Mbps entry tier — the lineup now starts at 300 Mbps. Pricing verified July 2026 against Comcast Business. Promotional pricing typically rises after the first 12 months — confirm renewal rates before committing.
The advertised price is not the monthly cost. Three additions that belong in any Comcast budget:
- Equipment rental — check your specific tier; Comcast bundles gateway hardware on some plans and charges separately on others
- Installation — varies by plan; confirm during the order process
- Autopay and paperless billing — the prices above assume enrollment; without both, add $10/mo
Comcast also offers a five-year price lock at roughly $20/mo above first-year rates on a one-year agreement. For a business that values budget predictability over the lowest headline number, that is often the better trade — carrier price increases at renewal are one of the more common surprises in a small business IT budget.
Coverage differs sharply. Based on serviceability checks we run across client addresses, AT&T Fiber reaches roughly 60–65% of Miami addresses while Comcast covers the large majority of Miami-Dade — our working estimate is around 92%. Neither carrier publishes address-level commercial coverage, so treat both as field observation rather than published figures. Our Miami business internet map plots what we have confirmed by neighborhood. Availability varies block to block, and many commercial buildings carry exclusive agreements — Lightpath serves numerous downtown high-rises, Hotwire operates in select mixed-use developments — that remove provider choice entirely. Verify serviceability at the specific address before committing, and ask building management about existing agreements before assuming you have options.
Alternatives and redundancy: T-Mobile 5G Business Internet runs $50 bundled with an eligible voice line or $70 standalone. Verizon 5G Business Internet starts at $69. Comcast offers a Connection Pro failover add-on (confirm current pricing during the order process). A UniFi U5G backup modem is $99 in hardware (not to be confused with the $399 U5G Max).
Deployment data: across our monitored South Florida locations, AT&T Business Fiber has measured 99.8% annual uptime, and fiber sites generally recovered faster than nearby coax during 2025 hurricane season incidents. Results vary by neighborhood, aerial versus underground plant, and utility restoration priority. Clients who install failover typically see their first genuine activation within 18 months.
The cost that rarely appears as a budget line is downtime itself. For a 10-person office, a day without connectivity runs into the low thousands in lost productivity and disrupted operations — against which a $30–$50 monthly failover circuit is inexpensive insurance. For a fuller treatment of local options, see the Miami business internet guide. For a hands-on assessment of the fiber option most of our clients use, see our AT&T Business Fiber review.
Security: What the Stack Costs
Deployment data — cost ranges from tooling we deploy and managed security engagements in this market.
Comprehensive security — tooling, monitoring, and the labor to run it — runs $150–$250 per user per month for a South Florida small business. That figure surprises people because they are mentally comparing it against antivirus software. The breakdown helps explain the gap.
Individual security controls:
| Control | Cost | Category |
|---|---|---|
| EDR software (alerting and telemetry) | $5–$8/endpoint/mo | Tooling |
| DNS filtering | $3–$5/user/mo | Tooling |
| Email security | $2–$6/user/mo | Tooling |
| Backup and disaster recovery | $5–$20/user/mo | Tooling |
| Security awareness training | $1.50–$3/user/mo | Tooling |
| Password management | $4–$8/user/mo | Tooling |
| MFA hardware tokens | $20–$50/user one-time | Tooling |
| Managed detection and response (MDR) | $40–$60/user/mo | Managed labor |
| Additional SOC, compliance, and incident response labor | $0–$80/user/mo | Managed labor |
A note on MDR: the $40–$60 line covers a managed service that includes both detection platform and human analyst response — it is labor-inclusive by nature. The additional SOC and compliance labor line covers broader security operations that sit outside the MDR scope: policy management, compliance administration, vendor coordination, and incident response beyond what the MDR provider handles. These two lines do not double-count the same work.
Overlap with your managed IT agreement is where the real double-counting risk lies. Some MSPs bundle basic security administration into their support rate, while others bill it separately. Ask which model your provider uses before adding the figures together.
How the tiers add up:
| Tier | Tooling | Managed labor | Per-user total |
|---|---|---|---|
| Foundation (MFA, DNS, basic EDR) | $15–$30 | $35–$50 | $50–$80 |
| Managed detection and response | $25–$50 | $75–$100 | $100–$150 |
| Compliance-heavy | $35–$60 | $115–$190 | $150–$250 |
The foundation tier includes basic security tooling plus the management labor to deploy, configure, and maintain it. The jump to the managed detection tier adds MDR and the monitoring coverage that makes it useful. Compliance-heavy adds broader SOC services, policy documentation, and audit support.
The insurance dimension
Insureon reports that its small business customers pay a median of $129 per month ($1,552 annually) for cyber liability insurance, with annual premiums ranging from roughly $400 to over $8,000. Insureon's sample skews toward very small businesses — most have fewer than five employees — so businesses in the 10–50 employee range covered by this report may see higher premiums depending on industry, revenue, data exposure, and security controls.
That last factor is the one that connects insurance to this report. Many applications and underwriters now ask for or price around MFA, EDR, and tested backups, and they may verify controls after a claim. The relationship between security spending and insurance cost is increasingly direct — implementing the controls listed above can materially affect both premium pricing and claims outcomes.
Hardware and Infrastructure
Network infrastructure is a capital cost with a five-to-seven year life. That makes its monthly amortized figure very small and its upfront figure substantial, and businesses tend to look at only one of those.
Deployment data — South Florida contractor rates from work we have performed.
| Project | Cost |
|---|---|
| 10–25 employee office network (installed) | $3,500–$8,000 |
| 30-person office — hardware only | ~$3,300 |
| 30-person office — project total | ~$4,800 |
| 10-person office — hardware only | $800–$1,500 |
| Structured cabling | $150–$200 per drop installed |
| Network closet UPS | $80–$400 |
The range is wide because the inputs vary: existing cable plant, ceiling access, building age, and whether the space is leased with restrictions on penetrations.
The cabling assumption is where budgets break. A 30-person project priced at $4,800 assumes the existing Cat6 drops work. Budget two to three failed drops per thirty as a baseline. Ten new drops adds $1,500–$2,000, which is not unusual in an older South Florida commercial building. Establish the state of your cable plant before you finalize any number — our network cabling cost calculator will size the drop count and material cost for your floorplan.
Workstation refresh
| Item | Cost |
|---|---|
| Hardware bundle per employee (computer + peripherals) | $1,500–$2,000 |
| Desktop | $800–$1,200 |
| Laptop | $1,000–$1,500 |
| Peripherals per workstation | $200–$400 |
Deployment data. Full-refresh project costs for a complete fleet replacement. These include the hardware bundle above plus imaging, configuration, data migration, spare-device allowance (10–15%), deployment labor ($100–$150 per workstation), and Florida sales tax:
| Fleet size | Estimated full refresh |
|---|---|
| 10 workstations | $18,000–$26,000 |
| 25 workstations | $42,000–$65,000 |
| 50 workstations | $85,000–$130,000 |
One approach we recommend to clients is the 25% rule: allocate a quarter of total hardware value annually, so the fleet turns over on a four-year cycle without a one-time shock. This converts an unpredictable capital event into a predictable operating line.
Replacement timing should follow performance rather than the calendar. A machine costing an employee ten extra minutes a day accumulates roughly 41 hours of lost time a year (assuming 250 working days) — about $1,458 per employee annually at an assumed $35/hour loaded rate, which often exceeds the cost of the replacement. A $1,200 laptop kept five years costs less per year than the same laptop replaced at year three because a policy said so.
Platform choice compounds
Deployment data. A 25-employee UniFi deployment costs approximately $1,754 in hardware with no recurring licensing. The equivalent Cisco Meraki environment runs $8,626 over the same five-year period, of which $4,140 is mandatory licensing — a difference of roughly $6,900 at this scale. Meraki buys centralized support and a different operational model; whether that is worth the premium is a real question, but it should be answered deliberately rather than by default. The gap widens with device count, but specific savings depend on the bill of materials. Our UniFi vs Meraki cost comparison shows the full working.
What South Florida Costs That Other Markets Do Not
Most IT cost benchmarks are national. They are not wrong, but they omit factors that materially change the number in this market. This section is entirely deployment data.
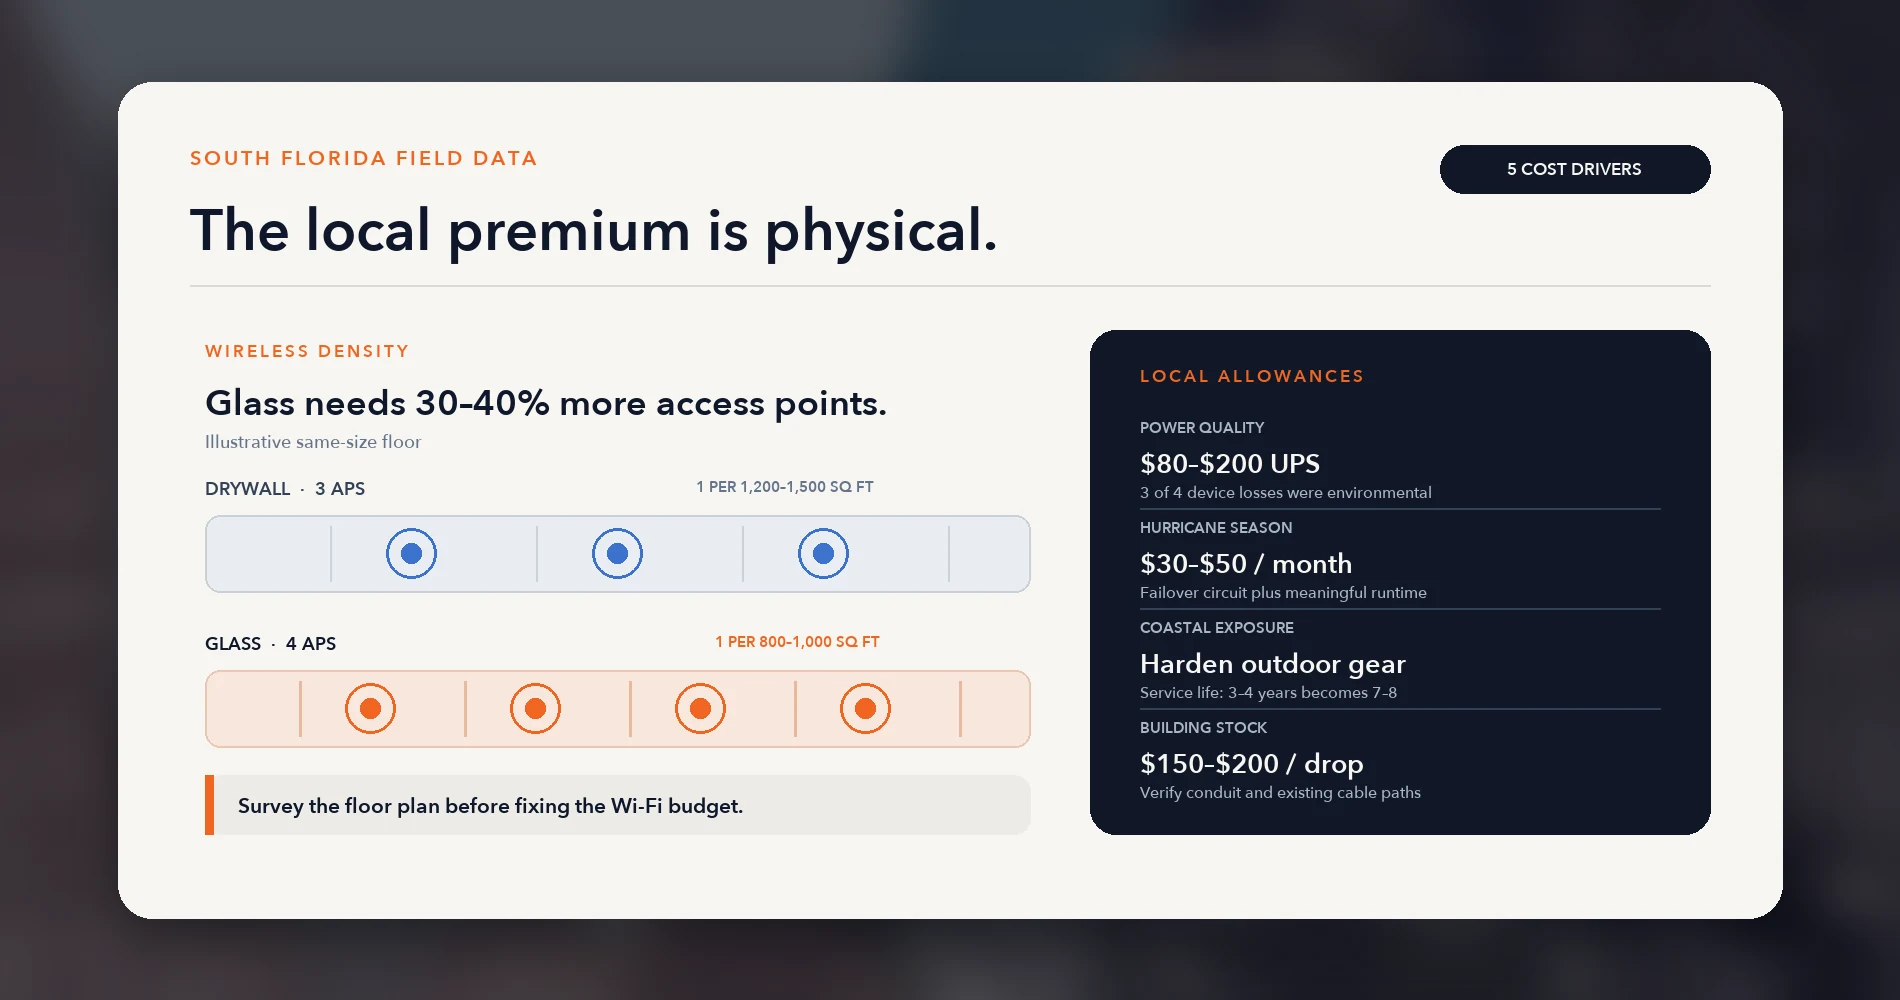
Glass construction. Brickell, downtown, and much of Coral Gables favor glass-partitioned offices. Glass attenuates wireless signal considerably. In our glass-heavy South Florida office deployments, access-point counts have typically been 30–40% higher than in similarly sized drywall spaces — roughly one AP per 800–1,000 square feet against 1,200–1,500 in traditional buildouts. Floor plan, glass coating, user density, and RF conditions can materially change the result. On a mid-size office that typically means one to two additional access points plus the cabling to reach them.
Power quality. Across 40+ office network installations in South Florida, power conditioning failures have caused more operational incidents than hardware defects in our experience. Afternoon thunderstorms produce voltage fluctuations that drop networking gear regardless of what it cost. Our four-year fleet data shows a consistent pattern: of four device losses across 538 units, three were environmental rather than defects. That is a small sample, but it aligns with what we see across deployments. A UPS at $80–$200 is standard in every deployment we do, and it is one of the most cost-effective reliability measures available in this market.
Hurricane season. June through November drives redundancy spending that inland markets do not carry — failover circuits, UPS sizing for meaningful runtime, cloud-first architecture that survives an inaccessible office. Cellular infrastructure here is increasingly hardened with battery and generator backup, which is why cellular failover often stays up when wired service does not.
Coastal corrosion. Deployment data. Salt air materially shortens equipment life near the water. In our coastal installations, properly hardened outdoor equipment has typically lasted seven to eight years compared to three to four years for unhardened gear — effectively halving the amortized cost. UV exposure, humidity approaching 100%, and lightning activity compound the effect.
Building stock. Conduit availability is the single most common install-day failure for commercial fiber here. Miami-Dade enforces specific low-voltage cabling codes, and plenum-rated cable is required where drop-ceiling spaces are used for environmental air return — which is common in South Florida commercial buildings. None of this appears in a national average.
Bilingual operations. English and Spanish support is a baseline expectation in this market rather than a premium service.
The Gap: Overspending and Underspending at Once
The most consistent pattern we encounter is not a business spending too much or too little. It is a business doing both simultaneously, in different categories.
What the audits found
Deployment data.
A 22-person professional services firm in Miami was carrying 34 active SaaS subscriptions. Eleven had fewer than two active users in the preceding 90 days. Three were outright duplicates — the same function covered twice, both billing monthly. Annual waste: $14,400.
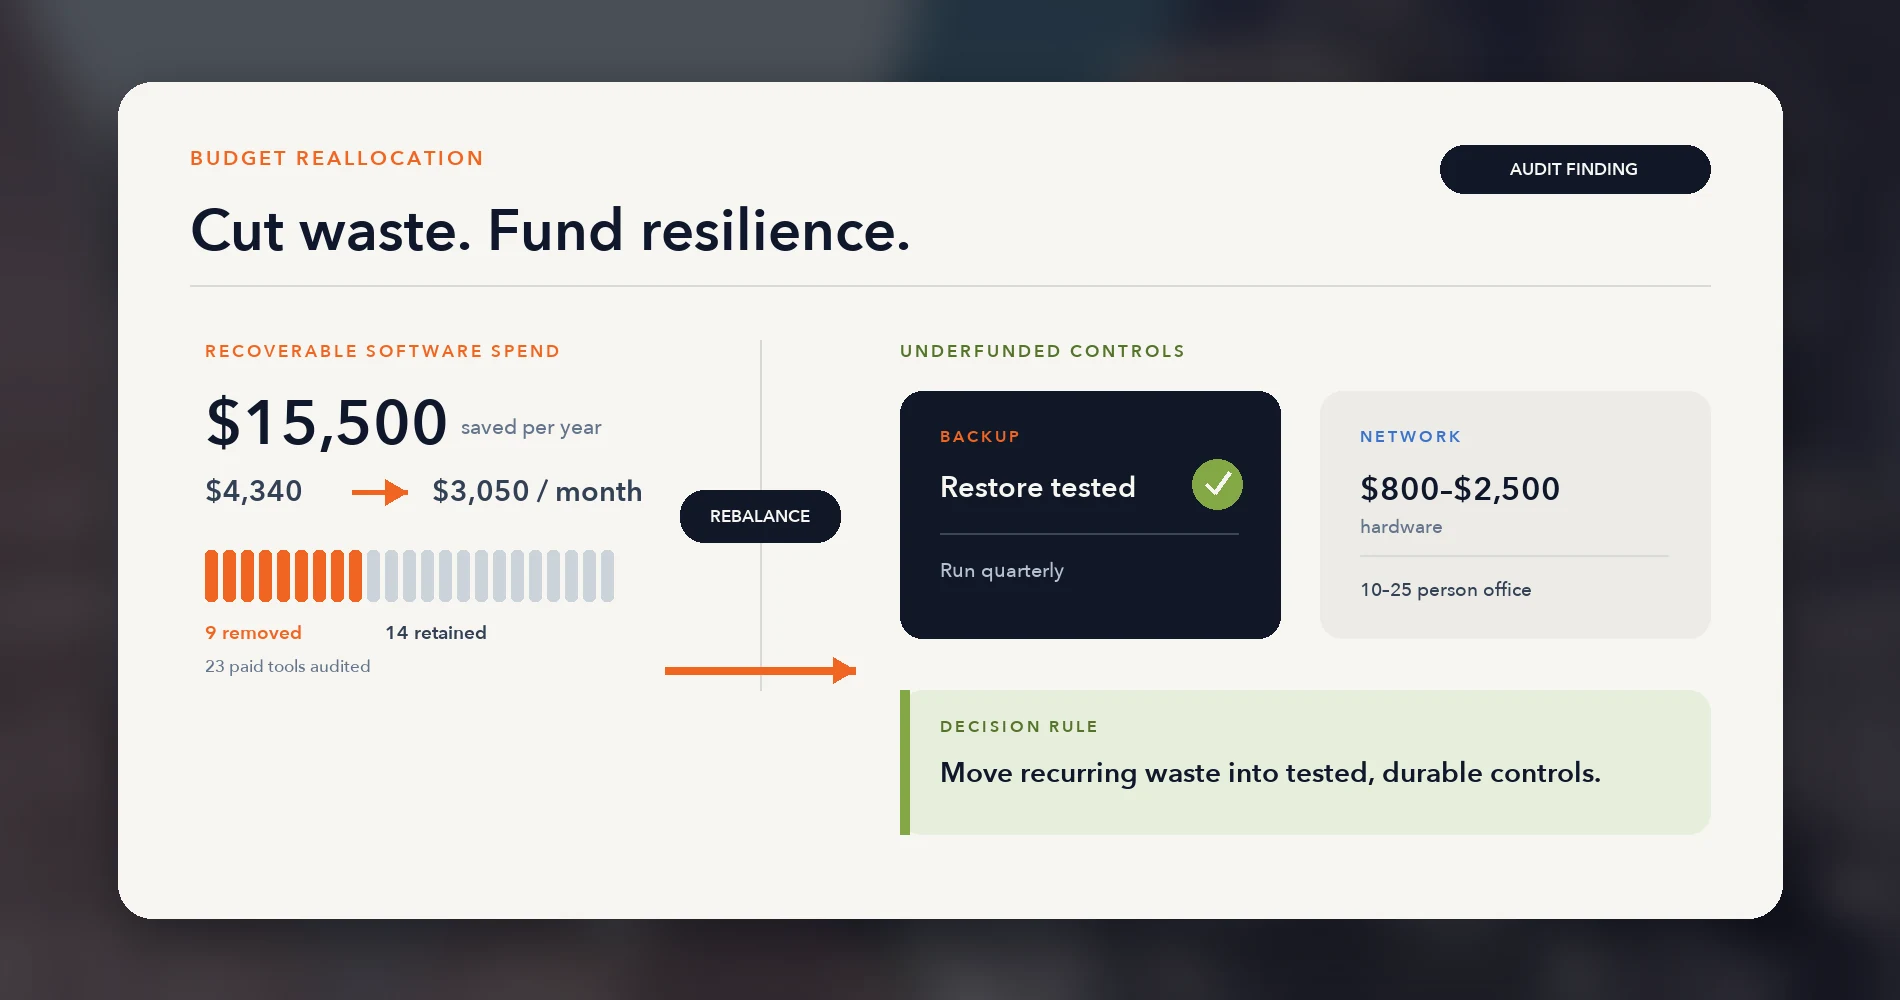
A separate stack teardown covered 23 paid subscriptions at $4,340 per month. After scoring each tool for cost, usage, access risk, and overlap, monthly spend came down to $3,050 — an annual saving of $15,500, or 30% of software spend. Nine tools were removed, four orphaned accounts belonging to former employees were closed, and three unmonitored OAuth grants were revoked. Total time invested: about six hours across two people.
This is not unusual. Zylo's 2026 SaaS Management Index draws on more than 40 million SaaS licenses and $75 billion in managed spend across nine years of data, and reports that 36% of SaaS licenses go unused. The average portfolio it tracks holds 305 applications — enterprise scale rather than small business, but the underlying behavior is consistent at 25 people and 34 subscriptions.
Where the waste concentrates
- Unused subscriptions. The typical 15–30 person business carries three to five tools nobody has opened in 90 days.
- Redundant pairs. Teams and Slack both active. Dropbox and OneDrive both paid. Each duplicate costs $15–$40 per user per month — $3,600–$9,600 annually for a 20-person team. The fix is a decision, not a purchase.
- Over-specified support tiers. Pulling the support tier on major subscriptions and downgrading anything never used typically recovers $100–$300 per month with no operational impact.
- Parallel platforms. Running Google Workspace and Microsoft 365 concurrently for ten users roughly doubles licensing cost and generates measurably more support overhead from format and sync conflicts.
Where the underfunding concentrates
The same businesses are usually thin in exactly two places.
Backup verification. We have audited environments running nightly backups faithfully for years where the restore had never been tested — and failed when finally run. That is the pattern worth internalizing: backup software reporting success is not evidence of recoverability. The cost of verification is a quarterly half-hour. Discovering a backup failure during an actual recovery is substantially more expensive.
The network underneath everything. A consumer router serving a 25-person office is a $200 purchase that costs multiples of that in downtime, slow transfers, dropped calls, and security exposure across its life. Business-grade networking for a 10–25 person office is $800–$2,500 in hardware, amortized to effectively nothing per month. We regularly encounter businesses that spent $15,000 on laptops and $200 on the network connecting them.
A useful diagnostic: if a category is more than 30% above the benchmark bands, review its scope, utilization, and contract terms. A higher figure may be justified by compliance requirements, multiple locations, bundled projects, or after-hours coverage — but it warrants explanation. If you are below the bands in backup or security, that is the category to examine first.
What Getting It Wrong Costs
Deployment data — documented outcomes from real engagements, anonymized.
| Situation | Cost |
|---|---|
| 12-person Brickell design firm, server failure with untested backup | ~$4,800 emergency response; $15,000–$20,000 in disruption; $20,000–$30,000 total |
| Consulting firm, three-day network outage | $12,000 in lost billable time, after declining $3,000 in IT support |
| 50-employee manufacturer, $35,000 in capex against $800/month support | Two outages, $12,000 in emergency repairs within six months |
| Ransomware incident, small professional firm | $35,000 demand (unpaid), ~$50,000 total impact, two weeks of recovery |
The Brickell case is the clearest illustration of the asymmetry. A 3-2-1 backup arrangement for a firm that size costs roughly $500 a year — a NAS amortized over five years, a cloud backup subscription, and verification. The failure cost forty to sixty times that.
The manufacturer case shows the other common shape: capital investment without the operating budget to support it. The incidents that followed cost several times more than the gap between $800 and $1,600 in monthly support.
For external context, Verizon's 2026 Breach Impact Study — a companion to the annual DBIR — reports an approximate $38,000 median impact for SMBs, rising to $96,000 in the mid-market segment, with the top 2.5% of large enterprise claims exceeding $22 million. IBM's Cost of a Data Breach Report tracks the same ground at enterprise scale. Both sit above what most small businesses assume, and above the cost of the controls that reduce risk.
In-House or Managed: The Arithmetic
| Model | Annual cost |
|---|---|
| Managed service provider (15 users at $125–$175/user) | $22,500–$31,500 |
| Support specialist, in-house | $79,000–$101,000 fully loaded |
| IT manager, in-house | $185,000–$230,000 fully loaded |
| Part-time / break-fix consultant | $3,600–$15,000 |
Loaded cost is what matters and it is consistently underestimated. BLS puts the national median wage for computer support specialists at $60,340 (May 2024). Our loaded-cost model adds employer FICA (7.65%), health premium contribution ($6,000–$14,000), paid leave, retirement match (3–6%), equipment, and recruiting amortization, bringing the real annual cost to $79,000–$101,000 depending on benefits tier. An IT manager is a different role at a different price — BLS reports a national median of $171,200 for computer and information systems managers, landing near $185,000–$230,000 loaded by the same model. These are national medians; Miami metro wages may differ.
Below roughly 30–40 employees, a managed agreement delivers more coverage per dollar, and the reason is structural rather than financial. One person cannot provide 24/7 monitoring, cannot cover their own vacation, and represents a single point of failure for institutional knowledge. In our experience, the break-even point depends on service level, industry, geography, and internal role — but it typically falls somewhere in the 40–60 employee range, and many businesses at that size land on the co-managed model described earlier rather than choosing one outright.
The comparison people skip is against doing it themselves. For a 15-person business, the fully counted cost of owner-managed IT — owner hours at their actual billing rate, staff time lost to technology issues, several outages a year, and the equipment waste that comes from unplanned purchasing — often exceeds the cost of professional support once all inputs are counted. The DIY cost is real; it is simply uncounted. Our guide on when to stop doing IT yourself works through the calculation.
What Changed This Year
Microsoft 365 pricing rose on July 1, 2026. Business Basic moved from $6 to $7 per user per month (+17%) and Business Standard from $12.50 to $14 (+12%). Business Premium held flat at $22. As part of the packaging update, URL time-of-click protection is being added to both Basic and Standard (Premium already had it), and all three Business tiers gain an additional 50 GB of email storage.
Two practical consequences. The Standard-to-Premium gap has narrowed to $8, which makes Premium the better value for most Windows-first businesses that need device management — Intune and Defender for Business are included rather than purchased separately. Existing customers remain on current pricing until their first renewal after July 1, per Microsoft's licensing page.
Windows 10 Extended Security Updates are a significant budget consideration for 2026. Microsoft's ESU program prices year one at $61 per device, doubling each year — $122 in year two, $244 in year three. Two details that change the math:
- Devices managed through Intune or Windows Autopatch qualify for a reduced first-year rate of $45 per device.
- The program is cumulative. Delaying enrollment to year two means paying year one retroactively, so waiting does not save money.
Although ESU costs less than replacing a computer on license price alone ($183 cumulative for two years, $427 for all three), it only provides security updates — no feature improvements, no extended support lifecycle, and no relief from aging hardware. For devices that are already approaching end-of-life on performance, the combined cost of ESU, increased support burden, reliability risk, and eventual replacement may make earlier migration the better decision. Verify actual compatibility first — many machines purchased in 2020 and 2021 run Windows 11 without issue.
AI tooling became a budget line rather than an experiment. Microsoft 365 Copilot lists at $21–$30 per user per month (SMB Copilot Business at $21, Enterprise at $30), with a promotional rate of $18 available through December 31, 2026, for 1–300 seats on an annual subscription. Google took a different approach: Gemini AI capabilities are now included in Google Workspace Business and Enterprise plans at no additional per-seat cost, which is a meaningful budget difference for Workspace-first organizations. The pattern that works is per-role rather than per-seat: license the people whose work is genuinely document- or analysis-heavy, pilot before broad deployment, and measure. A blanket rollout at $30 per user adds $750 a month to a 25-person business, which is a material line item to spend on unmeasured benefit.
Hardware pricing moved against buyers. On one 35-unit business laptop order in Q2 2026, we paid $127 more per unit than an identically specified quote from Q4 2025 — a $4,445 difference on a single order. Memory pricing has been the main driver. If you have a refresh planned, quotes are aging faster than usual.
Methodology
Scope. Businesses of 5–50 employees across several industries in Miami-Dade and Broward counties, concentrated in professional services, medical, legal, and hospitality.
Two kinds of evidence, labeled throughout.
Deployment data comes from our own work in this market: 20+ years serving South Florida businesses (founded 2003), 40+ office network installations, and a 538-device fleet monitored across four years. Project costs, install rates, audit findings, and environmental observations come from this body of work. It is aggregated and anonymized — no figure identifies an individual business, and no client counts, revenue figures, or account-level pricing appear anywhere in this report.
Third-party data is linked inline to its primary source. Vendor pricing was verified in July 2026 and will drift; check the live page before budgeting against it.
Our citation standard. We cite primary sources wherever available: a vendor for its own pricing, a government agency for its own wage data, a research firm for its own study.
Where a commonly repeated statistic could not be traced to a primary source, we left it out. That is why this report contains fewer numbers than it easily could, and why the ones about the South Florida market are presented as our own market knowledge rather than borrowed authority.
Market rate estimates. Most South Florida providers quote privately rather than publishing rates. Our characterization of local pricing reflects public provider materials and quotes clients have shown us during onboarding. It is our read of the market, not a survey, and it is presented as a band rather than a point.
Limitations. Our deployment data skews toward businesses that engage professional IT support, and toward professional services, medical, legal, and hospitality verticals. It underrepresents businesses operating without IT support entirely, and underrepresents retail, construction, and light industrial. Per-employee bands are derived from bottom-up category modeling rather than a formal survey of local businesses, and should be read as informed benchmarks rather than survey results.
Corrections. This report is revised annually. If you have data that contradicts anything here, or spot an error, we want to know — accuracy matters more to us than being right the first time.
Related Resources
- IT Budget Planning for Small Business — The planning framework behind these benchmarks.
- How to Choose IT Support in Coral Gables — 2026 pricing, provider checklist, and hurricane-readiness guide for Coral Gables businesses.
- IT Stack for a 10-Person Accounting Firm — What the compliance-heavy end of the range actually buys.
- Miami Business Internet Guide — Full connectivity pricing, coverage, and provider selection.
- We Ran 538 UniFi Devices for 4 Years — The fleet reliability data referenced throughout.
- When to Stop Doing IT Yourself — The in-house, DIY, and managed services comparison in detail.
Tools
- IT Support Cost Calculator — Model these bands against your own headcount and service level.
- Business Security Score — Check your controls against what insurers ask about.
- Miami Business Internet Map — Confirmed provider availability by neighborhood.
- Managed IT Services — What our own agreements cover.
Frequently Asked Questions
Related Articles
More from Miami IT
How to Choose IT Support in Coral Gables: 2026 Costs & Checklist
Compare Coral Gables IT support models, 2026 price ranges, SLA terms, cybersecurity and hurricane-readiness requirements. Includes a practical buyer checklist.
11 min read
Top 5 IT Service Companies in Miami for 2026
Compare Miami's top 5 IT service providers for 2026. From UniFi networks to enterprise security and compliance—find the right IT partner for your business.
16 min read
Miami Office Network Setup: Costs, ISP, Wi-Fi & Cabling (2026)
Plan a Miami office network with current 2026 ISP pricing, cabling and permit guidance, Wi-Fi sizing, sample budgets, security and deployment timelines.
27 min read